LMD ChartPack
Latest Version: 2025.1
Introduction
LMD ChartPack is a collection of 13 native VCL components that can be compiled into your application royalty free. This package was designed for clear and efficient graphic representation of data in VCL(.NET) applications. Different data sources (db, XML data etc. are supported). Several most popular 2D and 3D chart types are available - in this release 10 different main chart types are included, more will follow in subsequent releases. Configuration of both data-processing logic and visual representation is possible. At design-time various settings can tested by using an extensive visual editor.
Features
- Includes 13 controls for clear and efficient graphic representation of data in your applications.
- Includes additional 25+ components from the shared LMD VCL runtime package.
- 10 main chart types supported
- Datasensitive version included
- Full sourcecode of library included
- Extensive demo projects with sourcecode
- Free updates via Internet
- A Site License covers unlimited number of developers in same organization at one location
- Free technical support via forum (forum.lmd.de), e-mail, fax or mail
- Available as part of LMD-Tools or LMD VCL Complete
Screenshots
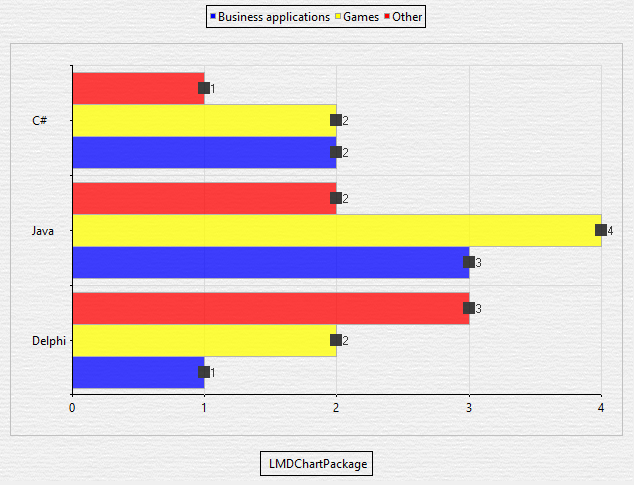
2D bar chart
The screenshot below demonstrates a 2D-Bar chart.
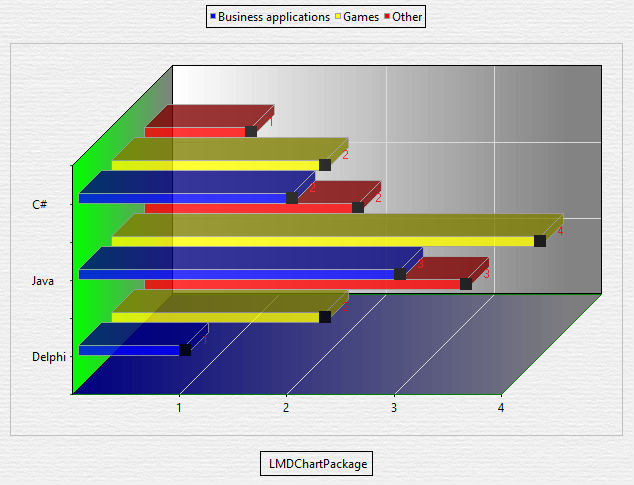
3D bar chart
The screenshot below demonstrates a 3D-Bar chart.
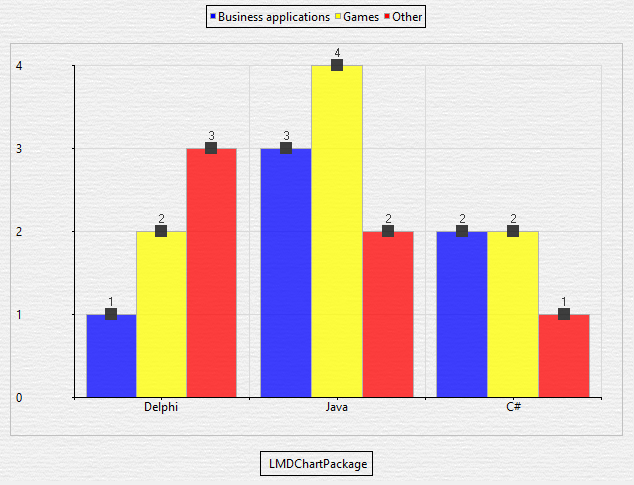
2D columns chart
The screenshot below demonstrates a 2D-Columns chart.
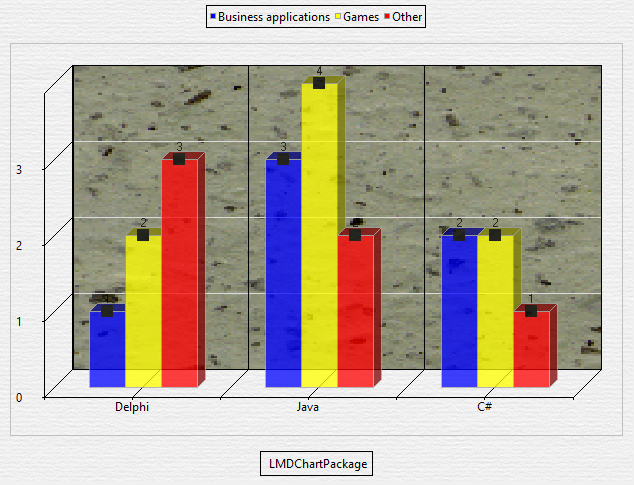
3D columns chart
The screenshot below demonstrates a 3D-Columns chart.
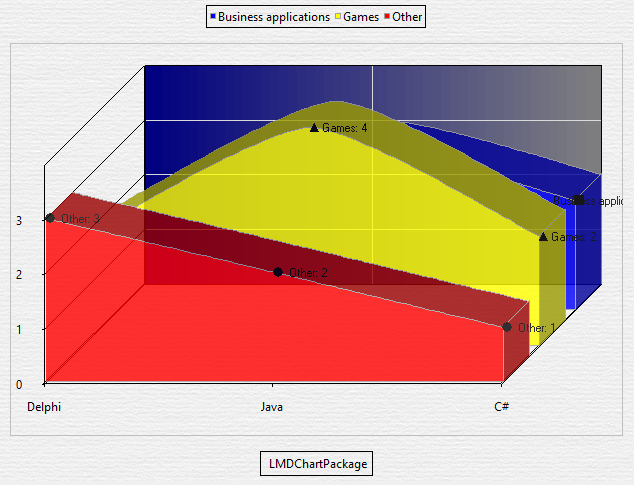
3D spline chart
The screenshot below demonstrates a 3D-Spline chart
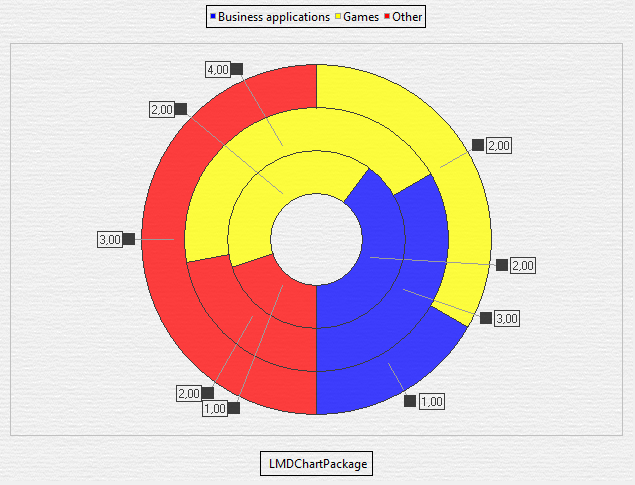
Doughnut chart
The screenshot below demonstrates a Doughnut chart.
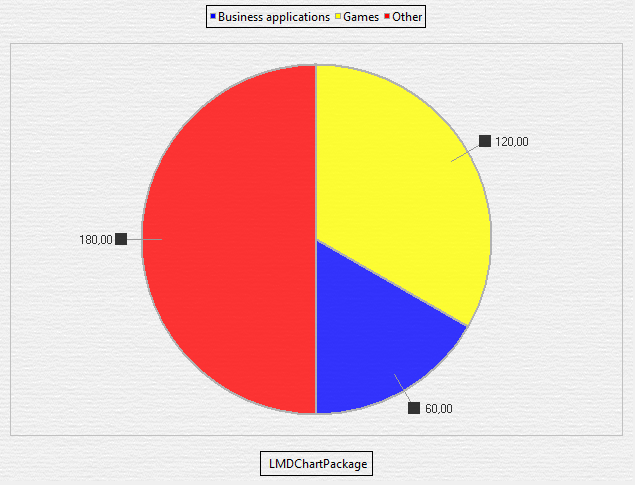
Circular diagramm chart
The screenshot below demonstrates a Doughnut chart.
Components

|
|

|
|

|
|

|
|

|
|

|
|

|
|

|
|

|
|

|
|

|
|

|
|

|
|

|
|